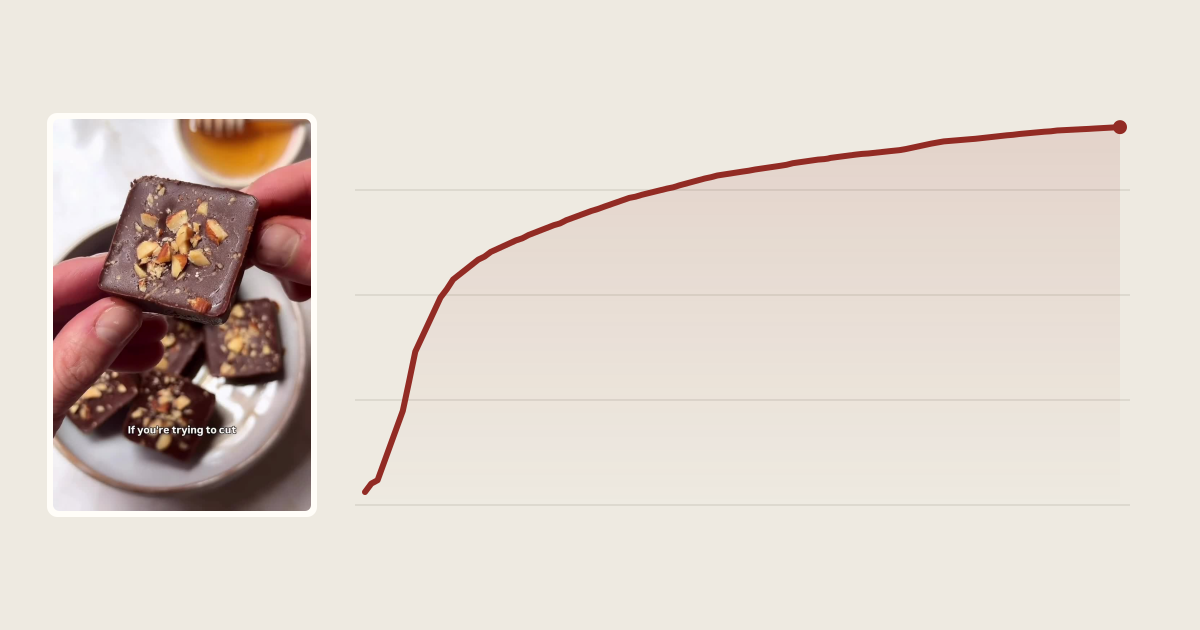
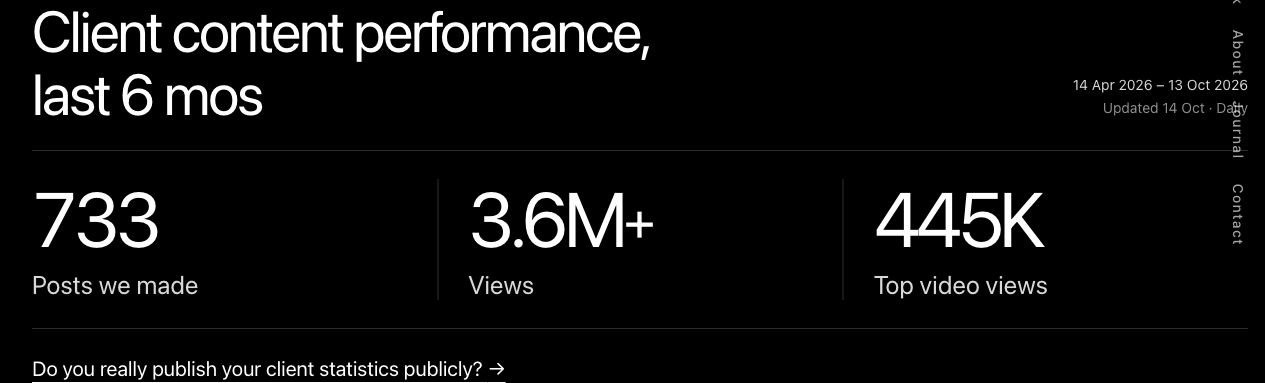
Near the top of our homepage, we now publish a dashboard of our client content performance. It shows how many posts we made over the last six months, their total views and the view count on the top video. The numbers refresh daily.
We’re doing this because we believe in what we do. It is easy to sell a busy content calendar. But a steady stream of posts where half the likes come from your own team is not much of a return on your expertise, your time or your budget.
We want our work to earn attention, and we think you should be able to see how it performs. For us, that is radical transparency: giving you something concrete to judge us by.
Publishing is only the beginning
We believe lasting growth starts with content people CHOOSE to watch, share and come back for. Organic success takes more than keeping an account active. It takes a useful idea, a strong opening, thoughtful production and close attention to what happens after you press publish.
The analytics are part of the creative work. They help us see which hooks and re-hooks hold attention, which questions resonate, which explanations get shared and which videos keep finding an audience long after their first day. Each result gives us something to learn from before the next shoot.
The platform behind the numbers
We built Boxscore, our proprietary content analytics platform, to bring that attention to every client relationship. It started as a more secure spreadsheet. Over time, we may have gotten a little carried away.
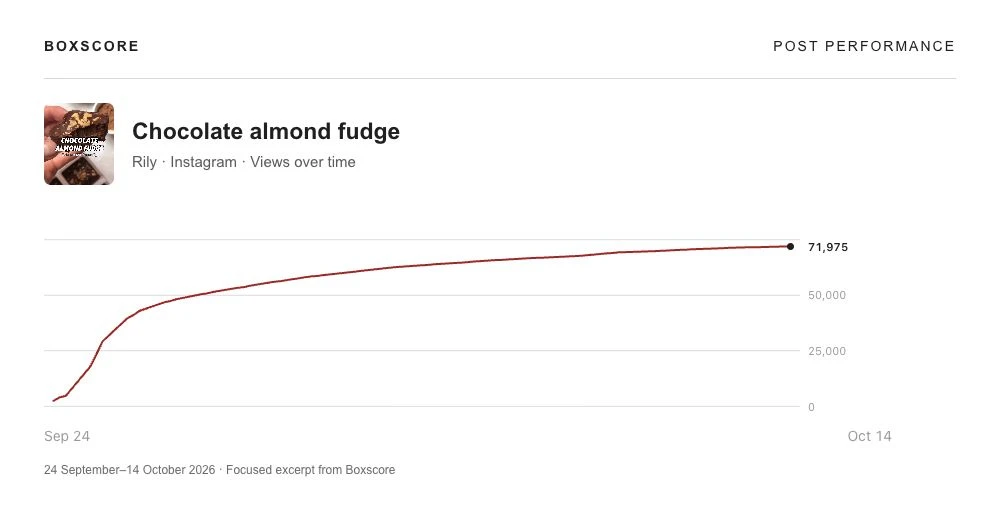
It connects results to the posts behind them and follows performance over time, giving our team and our clients a consistent record to work from.
The homepage is one small expression of that system. The bigger value is in the decisions it supports: what to make more of, what to improve and where a new opportunity is emerging.
Organic performance and paid support deserve a clear distinction
We also track which posts receive paid boosts, so we can report on organic performance and paid support with the right context. A video finding an audience on its own tells us something different from one reaching people through advertising. Both can be valuable. Combining them into one success story without that context would miss the point.
Boosting can help strong work travel further. Understanding what earns attention organically helps us decide which ideas deserve that support, and gives clients a clearer account of what their content and their media spend are doing.
Better reporting leads to better work
Even a little signal can point to a better next video: a question in the comments, an explanation people save, a topic they share. We bring those clues into the next shoot. Over time, those small improvements compound.
See the work. See the results.
The homepage shows aggregate results from recent client content we made. The reporting period and update date sit beside the numbers, so you can see what is included and how recently it was checked. Views are the recorded totals on posts published within that window; a plus sign indicates that some view counts are unavailable.
Detailed client reports stay private. What we are making public is a continuing record of our contribution, because confidence in the work should come with a willingness to show it.
See our latest client content results, or see how we build your social presence.